From Beginner to Analyst: How STRATEGIC Teaches
In the world of finance, trading is often seen as a game of luck. Many beginners believe success comes from following trends or copying other…
Mastering Fibonacci Retracement in the world of technical analysis, one tool has stood the test of time, not because it guarantees profit, but because it adds precision, discipline, and context to price movement: Fibonacci Retracement.
At STRATEGIC, we teach this tool not as a magical signal generator, but as part of a structured trading system.
Fibonacci retracement is a tool that helps traders figure out where the price of a stock or currency might pause or reverse. It’s based on a simple idea: when the price moves up or down, it usually doesn’t go in a straight line, it often pulls back a little before continuing in the same direction.
Let’s say the price of something goes from $100 to $150. After that big move, the price might drop a bit before going up again. Traders use the Fibonacci retracement tool to guess how far it might drop before it starts going up again.
The tool uses certain percentages to show these possible drop levels, like:
23.6%
38.2%
50%
61.8%
These numbers come from a special number pattern called the Fibonacci sequence, which is found in nature and math.
To find good points to buy or sell
To spot possible support or resistance levels
To understand if the current trend will continue
If a price goes from $100 to $150, and then starts dropping, traders watch these levels:
Around $130 (38.2% level)
Around $125 (50% level)
Around $120 (61.8% level)
At any of these points, the price might stop dropping and start rising again. So, traders look at these levels as possible turning points.
It’s not 100% accurate, it’s just a guide.
Works better when used with other tools, like trend lines or patterns.
Best used when the market is trending, not moving sideways.
Fibonacci retracement works because:
Many traders use it, so these levels become important. When a lot of people are watching the same price levels, the price often reacts there.
It’s based on natural patterns found in math and nature, like the 61.8% ratio, which also show up in how people behave in the market.
Prices in the market usually move in waves, they go up, then come down a little, then go up again. Fibonacci levels help guess where the price might stop and turn
When the market moves up or down a lot, we wait for it to pull back (go in the opposite direction for a bit).
We look at Fibonacci levels like 38.2% or 61.8% to see where the price might bounce back.
This helps us enter the trade at a better price.
After we enter a trade, we use Fibonacci extension levels to guess how far the price might go.
This helps us decide where to take profit, like at the 161.8% level.
We also use Fibonacci to place stop-loss orders.
That means if the price goes the wrong way, we get out of the trade quickly to avoid big losses.
We don’t use Fibonacci alone.
We also look at:
Trendlines
Support and resistance
Candlestick patterns
This helps us make better and safer trading choices.
At Strategic, Fibonacci helps us:
Buy at better prices
Know where to take profit
Keep our losses small
Trade with more confidence
It’s a smart tool that works well with our strategy.
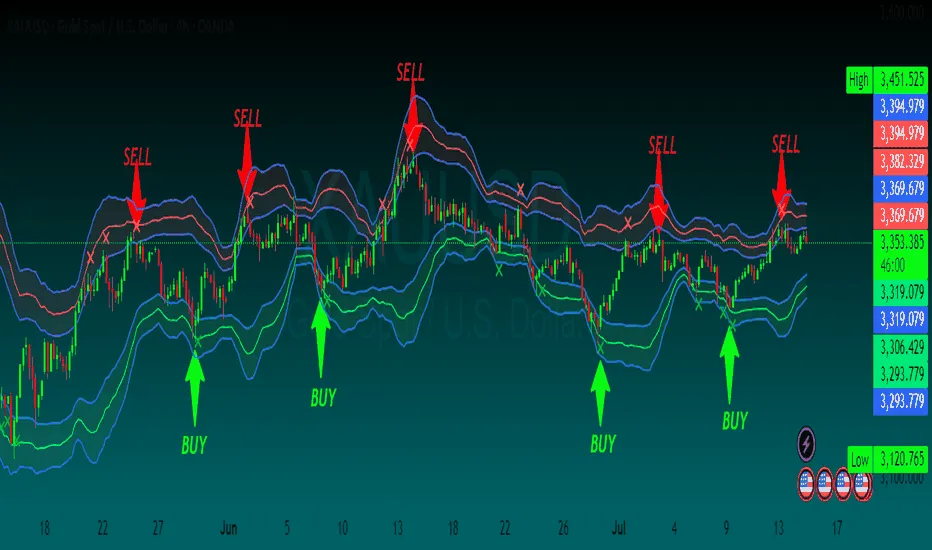
Fibonacci retracement is a useful tool in trading, but using it alone isn’t enough. At STRATEGIC, we turn it into a full system by combining it with other smart trading techniques. This helps us enter trades with more confidence and less guesswork.
We combine Fibonacci with:
Market Structure:
We look at how price is moving, is it making higher highs and higher lows (uptrend) or lower highs and lower lows (downtrend)?
Smart Money Concepts:
We look for liquidity grabs, where the market tricks traders before the real move begins.
Candle Confirmation:
We wait for strong candles like engulfing patterns or rejection wicks before entering.
Timing and Sessions:
We also watch for important times, like London or New York session opens, or major news events that affect the market.
Fibonacci is just a tool. But when used with a strategy, it becomes a full trading plan.
Before drawing Fibonacci, we first look at the direction of the market:
If the market is making higher highs and higher lows, it’s an uptrend.
If it’s making lower highs and lower lows, it’s a downtrend.
Never draw Fibonacci against the trend.
Example:
If price is going up and then dips slightly, we draw Fibonacci from the lowest point (start of the move) to the highest point (end of the move).
The most important Fibonacci zones are:
38.2%, Small pullback (trend is still strong)
50%, Middle point (often respected)
61.8%, Golden level (good chance of a bounce or reversal)
We call the 61.8%, 78.6% area the “Golden Pocket”, this is where smart money often enters the market.
If price enters this zone and starts rejecting, it’s a strong sign for a possible trade.
We don’t enter the trade right away when price touches a Fibonacci level. We wait for proof.
Look for:
A strong bullish or bearish engulfing candle
A rejection wick (also called a pin bar)
A structure break on a smaller timeframe
Once we get confirmation:
Set your Stop Loss below the 78.6% level (or last low)
Set your Take Profit at the previous high/low, or the 127% or 161.8% extension level
Pair: EUR/USD
Timeframe: 1 Hour
Trend: Uptrend
The price moved up strongly
It pulled back into the 61.8% zone
A bullish engulfing candle formed
We entered the trade
Stop Loss was placed below the 78.6% zone
Take Profit was set at the previous high
Result: A smooth and profitable trade with a good risk-reward ratio.
Drawing Fibonacci on wicks instead of candle bodies
Using it against the main trend
Entering trades just because price touched a Fib level
Ignoring other signals like support/resistance or confirmation candles
TradingView, Best for drawing clean Fibonacci levels
Trading Journal, Helps you track your setups and improve
Backtesting, Practice on at least 20 setups before trading live
Mentorship, Get feedback to fix emotional or technical mistakes
In our training sessions:
Students draw Fibonacci levels on live charts
Coaches give feedback and correct mistakes
We use Fibonacci for both short-term and long-term trades
Weekly results are tracked and reviewed to help you improve
This is not just theory, it’s real practice with expert guidance.
Fibonacci works best when you use it the right way, with a clear trend, confirmation, and a strong plan.
When used correctly, it becomes a powerful tool in your trading toolbox.
Want to learn more? Join our training program and start building your trading skills, one smart step at a time.
A: It’s a tool that helps traders find where the price might pull back (go the other way for a short time) before it continues in the same direction. It uses levels like 38.2%, 50%, and 61.8%.
In an uptrend, draw it from the lowest point (start) to the highest point (end).
In a downtrend, draw it from the highest point to the lowest point.
Always follow the direction of the trend.
38.2%, small pullback, trend is still strong
50%, common level where price might bounce
61.8%, powerful reversal area, called the “golden level”
A: Yes! It works on all timeframes, from 1-minute to daily charts.
But it’s usually more reliable on higher timeframes, like 1 hour or 4 hour.
A: Not always. It doesn’t give exact predictions, but many traders use it, so prices often react at those levels.
It works best when used with other tools like trendlines or candlestick patterns.
Retracement = where the price might pull back before continuing.
Extension = where the price might go next after continuing the trend (like 127% or 161.8%).
A: No! Always wait for confirmation.
Look for signs like:
A strong candle in your direction (engulfing candle)
A wick or rejection showing price bounced
A structure break on a smaller timeframe
A: Yes! It’s simple to learn and great for beginners, especially when you use a step-by-step method and practice regularly.
Drawing Fibonacci on the wrong move
Using it against the trend
Entering trades with no confirmation
Ignoring important timing, like news or session open
Use TradingView for drawing on charts
Keep a trading journal to track and improve
Do backtesting to test your setups
Get mentorship or join a training program for support and feedback
Fibonacci isn’t a shortcut to get rich.
But when used with discipline and a solid system, it:
Helps avoid random trades
Adds logic to stop loss and profit targets
Builds your confidence as a trader
At STRATEGIC, we teach Fibonacci not as a trick, but as a key part of a professional trading system.
In the Academy, ideas like these become a written plan, a trading journal and twenty mentor-validated trades.