

 shahzaib
 In the ever-evolving world of trading, few tools have stood the test of time like the Fibonacci retracement and extension levels. Whether you trade forex, stocks, crypto, or commodities, you’ve likely heard traders talk about how the Fibonacci sequence reveals hidden patterns in market price action. But what makes Fibonacci so powerful? Why do so many professional traders rely on it?. Fibonacci Secrets Every Trader Must Know.
The answer lies in the universal nature of Fibonacci ratios numbers that govern not only financial markets but also patterns found in nature, architecture, and even human behavior. These ratios help traders identify potential support and resistance levels, retracement zones, and price targets with surprising accuracy. Fibonacci Secrets Every Trader Must Know .
1. The Origin of Fibonacci: The Golden Sequence
Before diving into trading strategies, it’s important to understand where Fibonacci numbers come from. The sequence was introduced by Italian mathematician Leonardo of Pisa, known as Fibonacci, in the 13th century.
The sequence begins like this:
0, 1, 1, 2, 3, 5, 8, 13, 21, 34, 55, 89… and so on.
Each number is the sum of the two preceding numbers. As the sequence continues, the ratio between consecutive numbers converges toward 1.618, known as the Golden Ratio (or φ, phi).
In nature, this ratio appears in the spirals of shells, flower petals, hurricanes, and galaxies. In the financial world, it reflects the natural rhythm of crowd psychology, which creates repeating price patterns. This is why Fibonacci analysis is so widely respected in technical trading.
2. Why Fibonacci Matters in Trading
Financial markets move in cycles of expansion and contraction. After a strong move, prices tend to pull back (retracement) before continuing in the original direction.
Fibonacci retracement levels help traders identify where these pullbacks might end—giving potential entry points for trades in the direction of the trend. Similarly, Fibonacci extension levels project how far a price might go after a breakout or reversal. Fibonacci Secrets Every Trader Must Know .
The most commonly used Fibonacci ratios are:
-
23.6%
-
38.2%
-
50%
-
61.8%
-
78.6%
These percentages are used to measure potential correction zones within a price swing.
By mastering these ratios, traders can predict market turning points, support/resistance zones, and trend continuation levels the key ingredients of profitable trading.
3. The Psychology Behind Fibonacci Levels
Trading is largely driven by human emotions: fear, greed, hope, and regret. Because Fibonacci ratios reflect natural proportions, they often align with the collective psychology of traders.
For example:
-
After a big rally, traders look for a reasonable pullback to re-enter. Fibonacci retracements like 38.2% or 61.8% often feel “fair” psychologically.
-
During a downtrend, when prices start recovering, traders tend to take profit near Fibonacci extension levels like 127.2% or 161.8%.
These recurring behavioral patterns make Fibonacci levels self-fulfilling the more traders use them, the more effective they become.
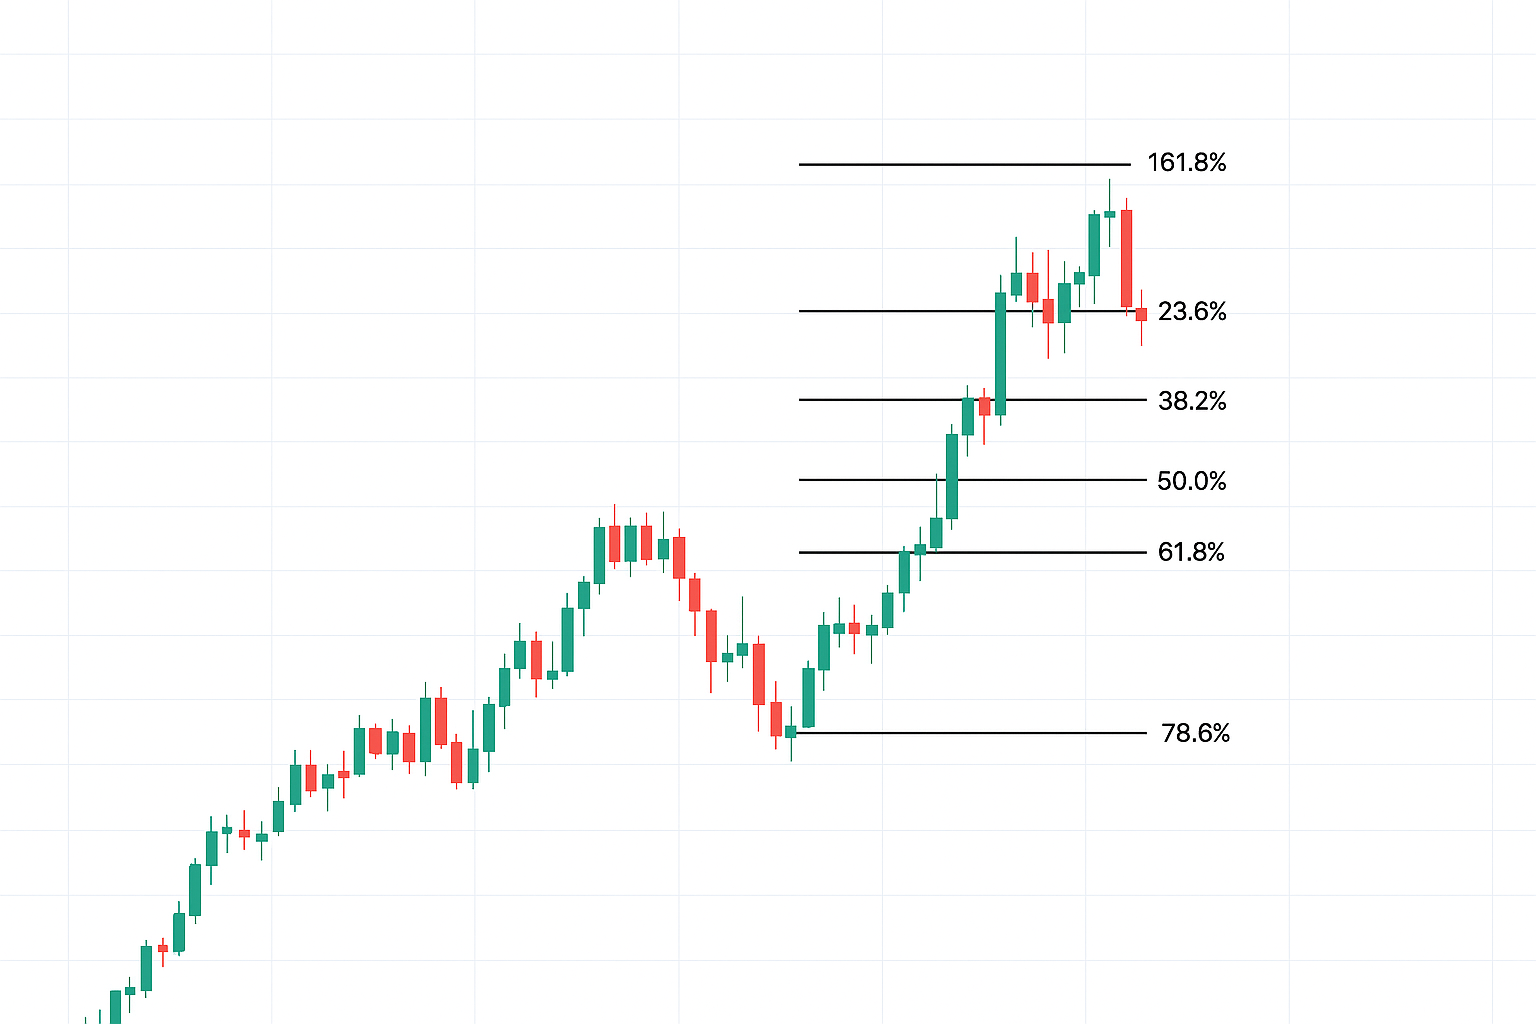
4. Understanding Fibonacci Retracement Levels
What Are Retracements?
Retracements represent temporary price pullbacks during a trend. The Fibonacci retracement tool divides the price range of a move into key levels that can act as support or resistance.
For instance, if EUR/USD rallies from 1.0000 to 1.1000, a 61.8% retracement brings price back to 1.0380. Many traders anticipate that level as a potential buy zone if the uptrend is still intact.
Common Retracement Levels and Their Meaning
-
23.6%: Shallow pullback; indicates strong momentum.
-
38.2%: Mild correction; normal in trending markets.
-
50%: Psychological midpoint (not a Fibonacci number but widely used).
-
61.8%: Golden retracement; often the last line of defense for trend continuation.
-
78.6%: Deep retracement; possible reversal point.
These levels help traders find optimal entries, set stop losses, and plan exit strategies.
5. Understanding Fibonacci Extension Levels
While retracements help identify pullbacks, Fibonacci extensions project future price targets once the trend resumes.
Common extension levels include:
-
127.2%
-
161.8%
-
200%
-
261.8%
These levels act as take-profit zones or resistance areas during a bullish trend and support areas in a bearish trend.
For example, after an uptrend retraces to 61.8%, traders often project a 161.8% Fibonacci extension to estimate the next price target.
6. How to Draw Fibonacci Levels Correctly
Correct application of Fibonacci tools is essential. Here’s the step-by-step guide:
-
Identify a clear swing high and swing low.
In an uptrend, draw Fibonacci from the swing low to the swing high.
In a downtrend, draw from the swing high to the swing low. -
Mark retracement and extension levels.
These will display potential reaction zones. -
Wait for confirmation.
Combine Fibonacci levels with candlestick patterns, volume, or moving averages for higher probability setups.
Accuracy in drawing ensures that your Fibonacci levels align with true market swings improving your trading consistency.
7. Fibonacci Confluence: The Hidden Secret
One of the most powerful Fibonacci secrets every trader must know is confluence when multiple Fibonacci levels from different swings overlap.
When a 61.8% retracement from a higher timeframe aligns with a 38.2% level from a smaller swing, it forms a high-probability reversal zone (PRZ).
Professional traders rely heavily on Fibonacci confluence zones, especially when they align with:
-
Trendlines
-
Support/resistance zones
-
Moving averages
-
Volume clusters
Such alignment often predicts significant reversals or strong breakouts.
8. Fibonacci in Trend Trading
Fibonacci tools are incredibly effective in trend-following strategies.
In an uptrend:
-
Buy near retracement levels (38.2% or 61.8%) after price pulls back.
-
Target extension levels like 127.2% or 161.8%.
In a downtrend:
-
Sell near retracement zones during rallies.
-
Target deeper extensions for profit-taking.
This approach helps traders stay in sync with the trend instead of fighting it.
9. Fibonacci and Price Action
When combined with price action analysis, Fibonacci becomes even more accurate.
For example:
-
A bullish engulfing candle at a 61.8% retracement indicates a strong buy signal.
-
A pin bar or hammer rejecting a Fibonacci level confirms buyer or seller interest.
-
When volume spikes occur at Fibonacci zones, it signals institutional participation.
Incorporating Fibonacci with price action turns guesswork into structured analysis.
10. Using Fibonacci Across Multiple Timeframes
Markets operate on multiple timeframes simultaneously. A Fibonacci level visible on the daily chart can dominate price action on the hourly chart.
The secret to consistency is multi-timeframe analysis:
-
Use higher timeframes (weekly/daily) to identify strong Fibonacci zones.
-
Refine entries on lower timeframes (H1, M15) using smaller Fibonacci swings.
When Fibonacci levels align across timeframes, the probability of success skyrockets.
11. Fibonacci Clusters and Advanced Techniques
Fibonacci clusters occur when multiple retracement and extension levels converge near the same price area. These clusters act as powerful reversal or continuation zones.
Advanced traders combine:
-
Fibonacci retracement,
-
Extension,
-
Projection, and
-
Expansion tools
…to map out high-probability trading areas. These methods are used by institutional traders and professionals to predict where big moves will begin or end.
12. The Power of Fibonacci Ratios Beyond Charts
Fibonacci doesn’t only apply to price it also applies to time and pattern structure.
Some traders use Fibonacci time zones to forecast when significant price moves might occur. Others apply Fibonacci ratios to measure wave lengths in Elliott Wave Theory, finding symmetry in market behavior.
This shows how deeply Fibonacci influences both price and time cycles in trading.
13. Common Mistakes Traders Make with Fibonacci
Even though Fibonacci is simple, many traders misuse it. Here are common pitfalls to avoid:
-
Drawing from the wrong swing points.
Always identify clear market structure before applying Fibonacci. -
Ignoring confluence.
Never rely on a single Fibonacci level in isolation. -
Overtrading.
Fibonacci levels show potential zones, not guarantees. -
Neglecting trend direction.
Don’t use Fibonacci retracements against a strong trend. -
Skipping confirmation.
Wait for price action signals before entering trades.
Avoiding these mistakes turns Fibonacci from a random tool into a professional trading weapon.
14. Combining Fibonacci with Other Indicators
Fibonacci analysis works best when combined with other indicators. Some of the most effective combinations include:
-
Moving Averages (MA): A retracement aligning with the 50-day MA often marks a strong bounce zone.
-
RSI (Relative Strength Index): Divergence near Fibonacci levels adds reversal confirmation.
-
MACD: A signal crossover at Fibonacci zones confirms momentum shift.
-
Bollinger Bands: When price hits a band and Fibonacci level simultaneously, it often reverses.
This multi-tool approach creates high-confidence setups.
15. Fibonacci and Risk Management
Even the best Fibonacci setup can fail without proper risk management. Use these guidelines:
-
Set stop-loss orders slightly beyond Fibonacci levels to avoid false breakouts.
-
Use position sizing to keep losses within 1–2% of account balance.
-
Set take-profit targets near extension levels.
-
Maintain a minimum risk-reward ratio of 1:2 or higher.
Fibonacci helps with logical trade placement but discipline ensures long-term success.
16. Real Example: Fibonacci in Action
Imagine Bitcoin rallies from $30,000 to $35,000. After the surge, price retraces to $32,900—near the 61.8% retracement.
A bullish engulfing candle forms, and RSI confirms strength. The trader enters long with a target near the 161.8% extension, around $37,000.
This trade combines:
-
Fibonacci retracement (entry)
-
Fibonacci extension (target)
-
Price action confirmation
Such alignment leads to higher-probability setups.
17. The True Fibonacci Secret: Simplicity and Consistency
The greatest Fibonacci secret isn’t hidden in complex ratios it lies in discipline and consistency. Many traders overcomplicate Fibonacci analysis by adding unnecessary tools.
The most successful professionals use Fibonacci to:
-
Define structure
-
Control risk
-
Maintain emotional stability
Fibonacci works best when you understand why it works and use it with patience.
FAQs
1. What is Fibonacci trading and why is it important?
Fibonacci trading uses key ratios derived from the Fibonacci sequence to identify potential support, resistance, and retracement levels in the market. These levels help traders find precise entry and exit points, predict pullbacks, and manage risk effectively across forex, stocks, and crypto markets.
2. What are the most common Fibonacci retracement levels?
The most widely used Fibonacci retracement levels are 23.6%, 38.2%, 50%, 61.8%, and 78.6%. Traders use these levels to measure how much of a prior move the price is likely to retrace before continuing in the trend’s direction.
3. How can I use Fibonacci extensions in my trading strategy?
Fibonacci extensions are used to forecast potential price targets after a breakout or retracement. Common extension levels like 127.2%, 161.8%, and 261.8% help traders plan take-profit zones and predict where momentum may slow or reverse.
4. Do Fibonacci levels work in all types of markets?
Yes, Fibonacci analysis works across forex, stocks, commodities, and cryptocurrencies. Since it’s based on human psychology and market rhythm, Fibonacci levels are universal—though their accuracy depends on the strength of the trend and correct chart placement.
5. What’s the biggest mistake traders make with Fibonacci tools?
The most common mistake is drawing Fibonacci levels incorrectly—using the wrong swing points or ignoring market structure. Another error is relying solely on Fibonacci without confirmation from price action, volume, or trend direction. Always combine Fibonacci with other technical tools for the best results.
Conclusion
Fibonacci trading is more than drawing lines it’s about understanding the natural rhythm of the market. The Fibonacci sequence reveals the balance between expansion and retracement, helping traders anticipate key turning points long before they occur.
By mastering Fibonacci retracements, extensions, and confluence zones, traders gain a strategic edge in identifying high-probability setups and managing risk effectively.
want to read more about trading click here
Big Shoutout to the guys who made this blog happen UDM.