

 shahzaib
 In the dynamic world of trading, few concepts are as foundational and as misunderstood as support and resistance zones. Whether you’re a beginner learning the basics of technical analysis or an experienced trader fine-tuning your strategy, understanding how to identify and trade around these levels can dramatically enhance your performance. Support and Resistance Zones: The Hidden Map of Price Action. Support and Resistance Zones: The Hidden Map of Price Action.
Think of support and resistance as the invisible roadmap of price actiona guide that reveals where buyers and sellers are likely to step in, where price reversals may occur, and how market sentiment evolves over time. When traders learn to read these zones effectively, they gain the ability to anticipate potential turning points and make data-driven decisions, instead of reacting emotionally to price fluctuations.
1. What Are Support and Resistance Zones?
At their core, support and resistance represent the natural tug-of-war between buyers and sellers in any market.
-
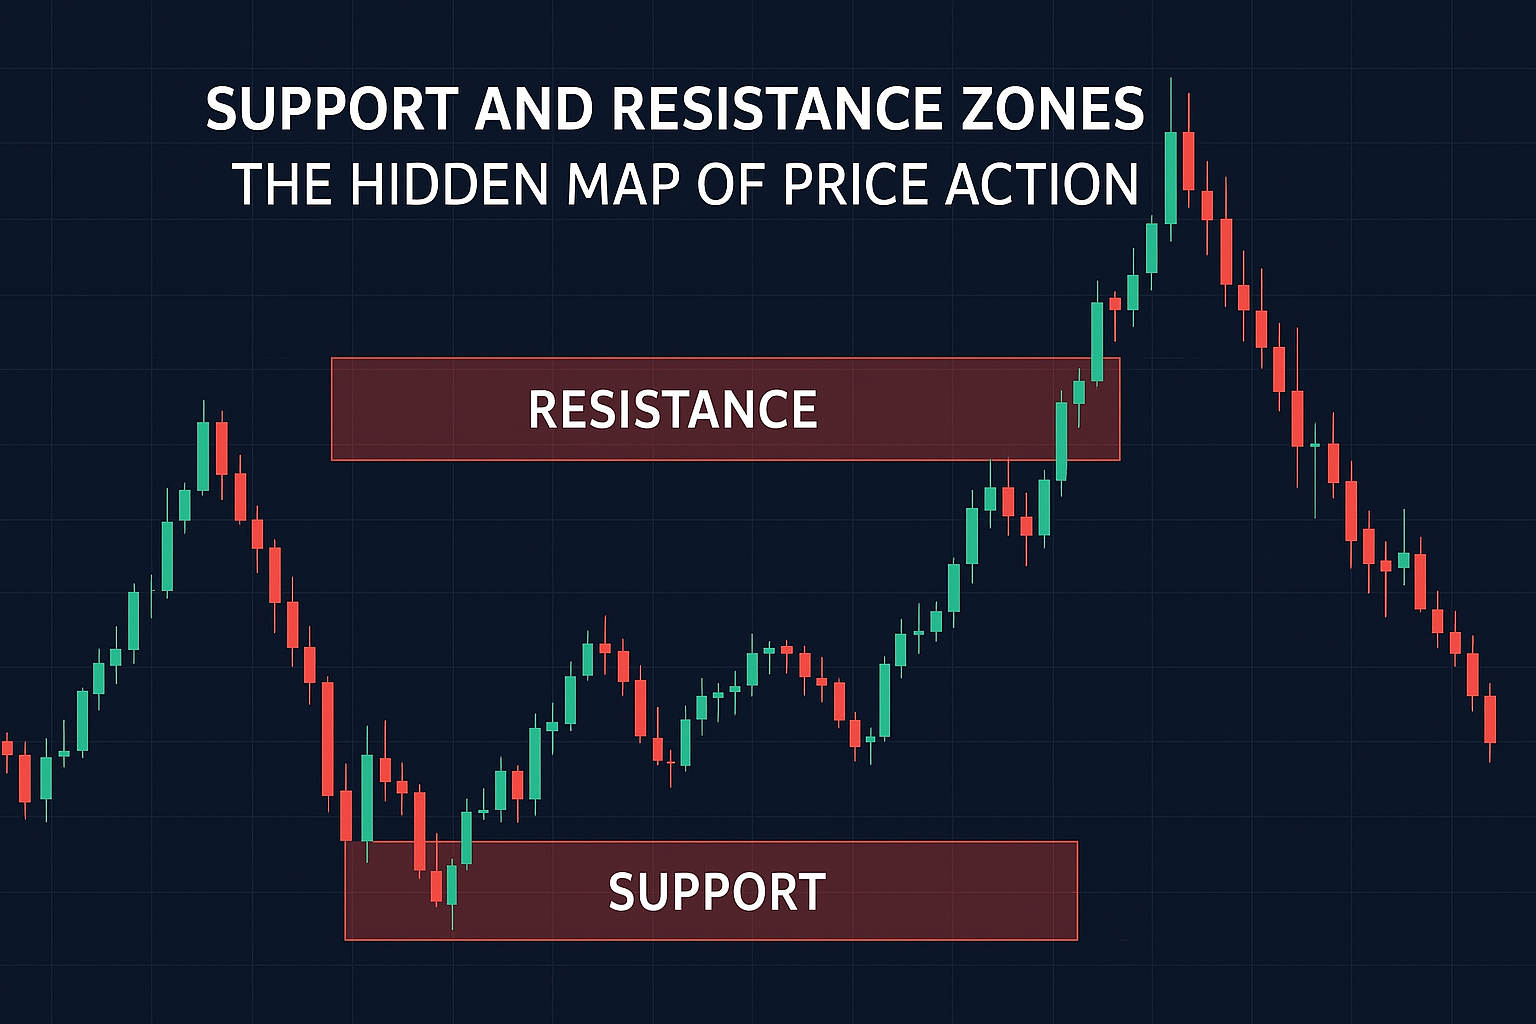
Support is a price level where demand tends to overpower supply. When the price falls to this level, traders expect it to “hold” or “bounce” as buyers enter the market.
-
Resistance is the opposite it’s where supply exceeds demand. When the price rises to this level, it tends to stall or reverse as sellers take control.
While many beginners draw support and resistance lines at exact prices, professional traders know that these are zones, not single lines. A support or resistance zone can span several price levels, reflecting the market’s uncertainty and the natural ebb and flow of buying and selling pressure.
These zones are critical because they reflect market memory areas where price has reacted before, and where traders are likely to react again.
2. The Psychology Behind Support and Resistance
Every price movement in the market reflects collective human behavior. To understand why support and resistance zones work, we need to understand trader psychology.
-
At Support: When the price reaches a known support zone, traders who missed earlier buying opportunities see a chance to enter at a better price. Meanwhile, sellers may hesitate, remembering how price previously bounced from this level.
-
At Resistance: When price approaches a familiar resistance zone, traders who bought lower may decide to take profit, while short-sellers see an opportunity to open new positions.
These repeated reactions create self-fulfilling price barriers. The more often a zone is tested and respected, the stronger it becomes in the minds of market participants.
That’s why understanding price action psychology is as crucial as understanding charts. Support and resistance zones reveal how fear, greed, and memory influence decision-making.
3. How to Identify Support and Resistance Zones
Identifying strong support and resistance zones is both an art and a science. Here are some proven methods:
A. Historical Price Reactions
Look for areas where price has repeatedly bounced or reversed in the past. These points highlight where large institutional traders are placing their orders.
B. Round Numbers
Markets often respect round numbers like 1.2000 in forex or $100 in stocks. These act as psychological barriers since many traders place orders around these levels.
C. Moving Averages
Dynamic support and resistance can form along key moving averages (like the 50-day or 200-day MA), often acting as guide rails for trending markets.
D. Fibonacci Levels
Fibonacci retracement levels (38.2%, 50%, 61.8%) frequently align with major support and resistance zones, providing high-probability trade setups.
E. Trendlines and Channels
Diagonal support and resistance zones are formed through trendlines that connect swing highs and lows, showing how price respects structure over time.
By combining these tools, traders can identify high-confidence zones where multiple forms of support or resistance overlap a concept known as confluence.
4. The Difference Between Zones and Lines
Many traders make the mistake of drawing a single horizontal line as support or resistance. But markets rarely reverse at an exact point. Support and Resistance Zones The Hidden Map of Price Action.
A support or resistance zone is a price range say, between 1.2050 and 1.2080 where reactions are likely. These areas reflect clusters of pending orders rather than a single trigger price.
The key advantage of using zones instead of lines is flexibility. It accounts for market volatility and gives traders a buffer for entry and exit, avoiding premature stop-loss triggers or missed entries.
5. How Support Becomes Resistance (and Vice Versa)
One of the most fascinating phenomena in price action is the role reversal of support and resistance.
When a price breaks below a support zone, that area often becomes new resistance. Similarly, when resistance is broken, it can turn into support.
This happens because of trader psychology:
-
Those who missed the initial move see a chance to enter on the retest.
-
Traders who were on the wrong side of the breakout may close or reverse their positions.
This flip zone behavior is crucial for breakout traders, as it provides opportunities to enter at retests rather than chasing price. Support and Resistance Zones: The Hidden Map of Price Action.
6. The Role of Volume in Confirming Zones
Volume acts as a powerful confirmation tool for support and resistance strength.
-
High volume at a zone means strong participation buyers or sellers defending the area aggressively.
-
Low volume breakouts are often false signals that quickly reverse.
By combining volume analysis with support and resistance zones, traders can filter out weak setups and focus on zones where genuine institutional activity occurs.
7. Using Price Action to Trade Support and Resistance
Once zones are identified, traders can apply different strategies to trade around them effectively.
A. Bounce Trading
Traders wait for the price to test a zone and show a rejection pattern (like a pin bar or engulfing candle). This signals that the zone is holding.
B. Breakout Trading
Here, traders wait for a decisive close above resistance or below support. The idea is to catch the momentum as price breaks free of a zone.
C. Retest or Pullback Trading
After a breakout, traders wait for the price to return and retest the broken zone. This offers a safer entry with defined risk.
D. Range Trading
In sideways markets, traders buy near support and sell near resistance repeatedly until a breakout occurs.
These techniques can be enhanced by combining candlestick patterns, trend confirmation tools, and risk management strategies.
8. Common Mistakes Traders Make
Even with the right understanding, many traders misinterpret or misuse support and resistance zones. Here are common errors:
-
Forcing zones on the chart without context.
-
Ignoring higher timeframes zones visible on the daily or weekly charts carry more weight.
-
Trading without confirmation, entering blindly at zones without price action signals.
-
Not accounting for fakeouts, where price briefly breaks a level before reversing.
-
Overcrowding charts with too many lines and zones, leading to confusion.
A clean, disciplined approach helps traders focus on quality zones that truly matter.
9. Multi-Timeframe Analysis
Professional traders don’t rely on a single timeframe. They combine multi-timeframe analysis to align short-term setups with long-term trends. Support and Resistance Zones: The Hidden Map of Price Action.
-
Higher timeframes (daily, weekly): Identify major zones and overall market direction.
-
Lower timeframes (1-hour, 15-minute): Spot entry points and refine stop-loss placement.
When zones align across multiple timeframes, they carry higher probability a signal that large market participants are watching the same levels.
10. Combining Support and Resistance with Indicators
While pure price action is powerful, indicators can strengthen decision-making.
Some useful combinations include:
-
RSI Divergence: If RSI shows divergence near a support or resistance zone, it signals a potential reversal.
-
Moving Averages: Dynamic support/resistance that aligns with static zones adds confluence.
-
Bollinger Bands: Price touching the outer band at a strong zone can indicate exhaustion.
The goal isn’t to clutter the chart but to combine evidence to increase the odds of success.
11. Support and Resistance in Different Markets
The concept of support and resistance applies universally but behaves differently across markets.
-
Forex: Influenced by economic data, central bank policies, and psychological round numbers.
-
Stocks: React to earnings, news, and institutional buying or selling levels.
-
Crypto: Often experiences more volatility, making zones wider and breakouts more frequent.
-
Commodities: Heavily impacted by supply-demand fundamentals, with strong reaction zones tied to global price levels.
Understanding the context of the market is key to using zones effectively.
12. The Hidden Map of Price Action
Support and resistance zones truly act as a hidden map a visual representation of where money moves in and out of the market.
-
They mark institutional footprints where big traders accumulate or distribute.
-
They outline risk zones areas to set stop losses or take profits.
-
They provide clarity allowing traders to anticipate rather than guess.
By learning to read these maps, traders gain the ability to predict reactions before they happen, giving them a strategic edge. Support and Resistance Zones: The Hidden Map of Price Action.
13. Building a Trading Plan Around Support and Resistance
A strong trading plan should always include a process for identifying and trading around support and resistance zones. Here’s a simple framework:
-
Identify major zones on higher timeframes.
-
Mark minor zones on lower timeframes for entry signals.
-
Wait for confirmation via candlestick patterns or volume surges.
-
Set risk-to-reward ratios of at least 1:2 or better.
-
Review trades weekly to refine zone accuracy and emotional control.
This structured approach transforms raw knowledge into consistent results.
14. Case Study: Trading the Retest
Imagine EUR/USD breaks above a major resistance zone at 1.0950. Price rallies to 1.1000, then pulls back.
A patient trader waits for a retest of the 1.0950 zone, which now acts as support. A bullish engulfing candle forms confirmation that buyers are defending the level.
The trader enters long, sets a stop loss below 1.0920, and targets 1.1100.
This setup combines:
-
Support turned resistance,
-
Price action confirmation, and
-
Risk management hallmarks of disciplined trading.
15. Why Support and Resistance Zones Never Stop Working
Markets change, technologies evolve, and indicators come and go but support and resistance zones remain timeless because they represent one thing that never changes: human behavior.
As long as fear and greed drive financial markets, traders will react to these levels. That’s why institutions, hedge funds, and retail traders alike still rely on support and resistance to navigate uncertainty.
FAQs
1. What are support and resistance zones in trading?
Support and resistance zones are key price areas on a chart where buying or selling pressure tends to appear. Support acts as a floor where prices stop falling and bounce upward, while resistance acts as a ceiling where prices stop rising and pull back. These zones help traders identify potential reversal or continuation points in the market.
2. How do I identify strong support and resistance zones?
Strong zones are identified by multiple price reactions at the same levels in the past. Look for historical bounces, volume spikes, round numbers, or Fibonacci retracement levels. The more times price has reacted to a level, the stronger that zone tends to be.
3. Can support and resistance levels change over time?
Yes. When the price breaks through a support zone, it often turns into a new resistance zone, and vice versa. This phenomenon, known as a role reversal, reflects changing market sentiment as traders react to new price behavior.
4. Do support and resistance zones work in all markets?
Absolutely. These zones are universal concepts used in forex, stocks, commodities, and cryptocurrency trading. While volatility and reaction strength may differ, the psychology behind support and resistance remains the same across all markets.
5. How can I use support and resistance zones to improve my trading strategy?
Use support and resistance zones to plan entries and exits, set stop-loss and take-profit targets, and confirm price action signals. Combining these zones with tools like candlestick patterns, moving averages, and volume analysis helps improve accuracy and consistency in trading decisions.
Conclusion
Support and resistance zones are far more than lines on a chart they are the hidden map of price action, showing where traders have acted before and where they’re likely to act again. By mastering the art of reading these zones, traders can anticipate moves, plan better entries, and manage risk with precision.
Whether you’re trading forex, stocks, or crypto, understanding these zones unlocks a new level of clarity and confidence.
Remember: the market leaves clues. Support and resistance zones are those clues waiting for the trader with the patience and discipline to follow the map.
want to read more about trading click here
Big Shoutout to the guys who made this blog happen UDM.